Food Stamps and Unemployment in Bristol VA-TN
by Lewis Loflin
See 2015 update below.
Wages tumble toward 18-year low. USA Today (October 16th, 2009) is reporting that the bad economy and low inflation are starting to drag down wages for millions of everyday workers and freeze benefits for millions of retirees. Average weekly wages have fallen 1.4% this year for private-sector workers through September, after adjusting for inflation, to $616.11, a USA TODAY analysis of Bureau of Labor Statistics data found. If that trend holds, it will mark the biggest annual decline in real wages since 1991.
The bureau's data cover 82% of private-sector workers but exclude managers and some higher-paid professionals. "Wages are usually the last thing to deteriorate in a recession," says economist Heidi Shierholz of the liberal Economic Policy Institute. "But it's happening now, and wages are probably going to be held down for a long time." In Bristol this has been a fact of life for decades.
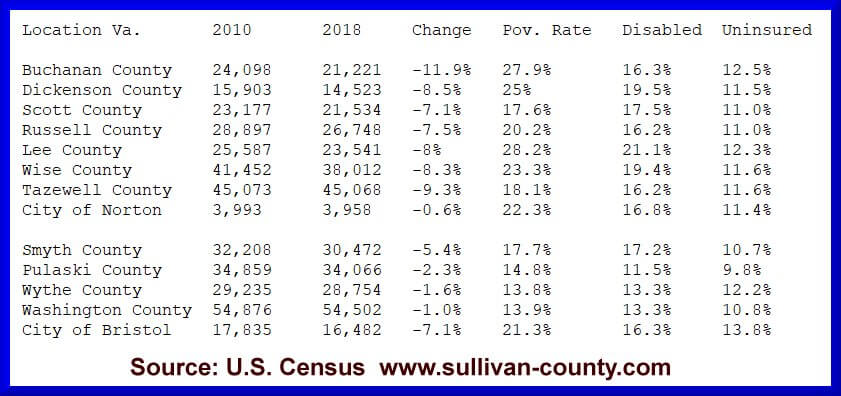
See Rising unemployment masked by phony statistics. The real unemployment rate in Bristol and Tri-Cities has been between 15% and 20% for years when we factor in gross under-employment and under-paid. In December 2009 more bad news for the Obamanites: another 85,000 jobs lost and over 600,000 left the workforce.
They claim the unemployment rate is steady at 10%, but nobody on the street is buying it. Food stamp usage has exploded across the Bristol Virginia/Tennessee region on average by one-third. The following is from the New York times Food Stamp Usage Across the Country (November 28, 2009) to quote, "The number of food stamp recipients has climbed by about 10 million over the past two years, resulting in a program that now feeds 1 in 8 Americans and nearly 1 in 4 children."
In Bristol Virginia area:
Bristol VA:
All people 25%
Children 48%
White 24%
Black 49%
Change since 2007: +29%
Washington County, VA:
All people 12%
Children 24%
White 12%
Black 18%
Up: 27%
Scott County, VA:
All people 14%
Children 28%
White 14%
Black 11%
Change since 2007: +27%
Sullivan County, TN (Includes Kingsport and Bristol, TN):
All people 15%
Children 30%
White 15%
Black 25%
Change since 2007: +28%
Johnson County TN:
All people 15%
Children 30%
White 15%
Black 25%
Change since 2007: +29%
Washington County TN (Includes most of Johnson City):
All people 14%
Children 26%
White 13%
Black 30%
Change since 2007: +32%
Carter County, TN:
All people 18%
Children 35%
White 18%
Black 13%
Change since 2007: +22%
For comparison Roanoke:
All people 20%
Children 39%
White 12%
Black 38%
Change since 2007: +30%
Norton, VA:
All people 26%
Children 48%
White 25%
Black 37%
Change since 2007: +4%
Knoxville, TN (Knox County):
All people 13%
Children 24%
White 11%
Black 36%
Change since 2007: +33%
For more on this see www.nytimes.com.
Factors to consider when reading these numbers: In Virginia the reason for such high poverty and food stamp rates is the inability of most Virginia cities such as Bristol, Roanoke, and Norton to annex and scatter poverty over a larger area, and the presence of public housing units. All three also have above average for this rural region black populations.
The stats in this respect are no better in Kingsport or Johnson City in my opinion. In Tennessee the cities were merged into the counties and cities can annex almost at will snatching up most of the county tax base. The stats look lower because the problem statically is spread over a larger area.
Update for 2015 quoting Dr. Steb Hipple Tri-Cities Labor Market Report East Tennessee State University - Third Quarter 2014 where job losses have continued for eight consecutive quarters:
Existing labor market trends dominated the Tri-Cities Consolidated Statistical Area (CSA) in the third quarter. Compared to the same period in 2013, regional employment was lower by 1.7% to 218,244, while unemployment fell 10.3% to 16,664 as discouraged job seekers continued to leave the regional labor force. The summer unemployment rate for the metro area was 7.1% (compared to 7.7% a year earlier). With the labor force shrinking by 2.4%, the falling jobless rate is a sign of labor market weakness.
During the July to September period, employment was lower in all three cities - falling 2.2% in Kingsport, 2.0% in Johnson City, and 1.2% in Bristol. Matching the regional pattern, large numbers of unemployed workers are exiting the labor market in each city. This has lowered the jobless counts, contracted the labor force, and reduced the unemployment rates. The percent of workers unemployed was 7.0% in Kingsport, 7.1% in Johnson City, and 7.1% in Bristol. As in the metro area, the lower rates in each city reflect labor market weakness.
Return History, Causes of Poverty in Southwest Virginia

To quote Lenowisco Broadband Study Warned against Call Centers (PDF file):
"The region has been replacing traditional (better paying) manufacturing jobs with (low paying subsidized) call center jobs, which provide limited advancement and work opportunities. Call centers represent the factory floor of the Knowledge Economy; they are an important part of a diversified economic development strategy, but the region must be careful not to rely too heavily on them, as the work is easily moved to other regions and/or other countries."No US Job Creation 1999-2009
- Emory & Henry Launches 9,000 Watt Station Paid for by Tax Dollars
- Boucher: $4 Million for Green Construction Training Program
- Federal Loan Helps Build New, Welfare Town Homes in Wytheville
- Boucher Misuses $2.5 Million for Country Music Museum
- Congressman Boucher, DIRECTV, and Virtual Jobs
- Congressman Boucher Brings Home the Bacon in 2009
- Congressman Boucher's Failed Call Center Legacy
Lenowisco Broadband Study Warned against Call Centers (PDF file)
- Congressman Boucher Defeated in 2010
- Bristol Virginia Utilities Update for 2009, 2019
- Bristol Virginia Utilities Goes Independent
- Government War on American Labor Good for Commerce
- Wise Virginia Call Center Won't Hire 500 New Workers
- Tobacco Commission Sykes Fiasco Reveals Government Waste
Cable Ready Socialism
How CGI-AMS and Northrop Grumman Failed Russell County
How Cable Ready Socialism Failed Southwest Virginia
Sprint Jumps State Line Collects Millions
U.S. Solutions Dumps Bristol Virginia for Bristol Tennessee
Travelocity Fails Dickenson County
- Sustainable Woods wood-processing facility in Castlewood not sustainable
- Critical Look at Appalachian Sustainable Development
- Rebuilding of Appalachian Harvest's packing, grading facility nearing completion
- Alpha Building Fiasco Five Years Later
- More on the Dirty Alpha Coal Building Deal
- The Dirty Alpha Coal Building Deal
- Southwest Virginia Miners Lose Jobs We Get Minimum-Wage jobs Instead
- Government Lies on Employment Gains October 2014
- More Chaos in the Job Market for Tri-Cities November 2009
- Food Stamps and Unemployment in Bristol VA-TN
- Economic Developers in Tri-Cities Pleased with Job Losses
- Virginia Tobacco Commission Scandals 2014
- More on Phil Puckett and the Virginia Tobacco Commission Scandal
- Virginia Tobacco Commission Waste and Pork Update for 2009-14
- Local Leaders Complain to Senator Kaine - Ignore Workers
- Predominant Face of American Poor is White
- Proof Limiting Mass Immigration Helps the Working Poor
- Born Again Jobs and a Shrinking Tri-Cities Labor Force
- Prime Choice Foods Files for Bankruptcy in Bristol
- What 70 New Jobs at Columbus McKinnon?
- Another 100 Jobs Lost in Bristol Virginia with College Closure
- Bristol Metals fires 290 Workers
- 240 Phony Jobs and Corporate Welfare for Heritage Glass
- Bristol Raising Property Taxes to Pay for Corporate Welfare
- Caterpillar Plant Closure Costs Pulaski County 240 Jobs
- Arch Coal Fires Another 213 Workers - It's the tip of the Iceberg
- High Cost of the Non-Profits Industry
Quick navigation of my homepage:
