How Ecological Homeostasis and Hysteresis Regulate Climate
Environmentalism has 'become a religion' and does not pay enough attention to facts.
Says James Lovelock. In his Gaia hypothesis, James Lovelock stated that the entire mass of living matter on Earth (or any planet with life) functions as a sort of vast organism that self-regulates its environment. Thus the planet maintains homeostasis.
Silly religious undertones aside, there are many simple examples of homeostatic mechanisms everywhere. When atmospheric carbon dioxide levels rise, plants can grow faster, thus removing more carbon dioxide from the atmosphere.
Greenhouse operators introduce extra carbon dioxide to speed plant growth. Calling carbon dioxide "carbon pollution" makes as much scientific sense as calling oxygen a carcinogen, which it technically is.
Dr. Lovelock has pulled back from his 2006 book "Revenge of Gaia" and states, "I was a little too certain in that book. You just can't tell what's going to happen." The Guardian 3/30/2014.
I'll attempt to put this complex subject into layperson's terms without religion.
When dissolved in water, carbon dioxide forms a weak acid that, in the rain, will erode limestone creating natural caves. In other reactions, it becomes natural cement that, with silica, for instance, could form beds of sandstone by binding sand particles.
Carbon dioxide is a trace gas forming 0.03 to 0.04 percent of the atmosphere. Many times that once existed in the atmosphere when the earth was far more lush and full of life than today.
One popular but false claim is that the oceans are becoming acidic because of increased trace gas C02. This claim is false because the pH of the oceans is basic at 8.2. Below 7.0 is acid.
Again, the earth's ability to self-regulate or homeostasis steps in. As CO2 dissolves in the oceans, it interacts with dissolved magnesium and calcium ions to form limestone and chalk through biological organisms, sea shells, and coral. The extra CO2 becomes rock.
Homeostasis keeps things reasonably constant over time.
There is no chance the oceans would ever become "acid" or even less basic unless one had hyper-massive levels of super volcanic activity or a significant meteor impact that poisons the entire biosphere with toxic gases and ash.
Hysteresis is "literally, to be late." Systems that do not directly follow the forces applied to them but react slowly or don't return ultimately to their original state.
In the environment, the interaction between homeostasis and hysteresis is much too slow to be observed except over more extended periods.
Predicting climate decades in advance is scientific nonsense. We can study past geological-historical records that contradict present alarmist computer models - CO2 played little part in past climate changes in the last three million years.
Through homeostasis, Gaia adjusts to any factor within reason introduced into the system. The main factors are random and unpredictable, thus making these computer-model crystal balls a running joke - none over the last 50 years has worked out in the real world.
Computer models can't predict the future interaction between the solar wind and cosmic rays. The sun throws out electromagnetic radiation (heat, light, UV, etc.) and solar wind. All electromagnetic radiation will become heat as it moves through the system.
Solar winds are positively charged protons (hydrogen atoms stripped of their electrons) diverted mainly by the earth's magnetic field. But magnetic domains can't deflect electromagnetic radiation because it has no charge. But solar winds can stop or attenuate cosmic rays and other forms of high-energy electromagnetic radiation.
High sunspot activity can vary heat output and solar winds. That means more heat-solar wind is delivered to Gaia and fewer cosmic rays reach the atmosphere forming clouds that reflect sunlight.
So less cloud cover combined with higher levels of solar radiation will cause climate variation closely related to solar cycles in addition to the variations to the earth's axial tilt and orbit around the sun.
Cosmic rays aren't constant either. Exploding stars produce random bursts of stellar radiation. Sorry, computer modeling is impossible. Thus more solar radiation-wind introduces more energy into the earth's biosphere combined with less cosmic radiation- thus clouds - that lets in even more light, etc., that becomes heat.
We had hysteresis kick in as the effects were not immediate and took time to build up. That has been the case since the late 1970s, which caused problems into the early 1990s as atmospheric expansion produced more significant "drag" on low-orbiting satellites bringing the old Skylab back to earth in 1979.
The sun pumped a lot of energy into the system for several years. It took time for this extra energy to move through the system as oceans absorbed it, etc.
In the book History of the Earth by William K. Hartmann (P. 223, published in 1991), he brought up the issue of global warming, and he sounded the alarms of others at this time.
The chart on the page was the infamous "hockey stick" of Michael Mann. As of publication, most of the temperature change was before 1980, wiggled around until 1990, then predicted to shoot off the charts after 1990.
Most of the temperature rise was in the 1930s and not the 1990s, as it turned out. Researchers at the University of Delaware have discredited Mann since that time.
Spare me the data NASA uses - a Senate hearing revealed the data tampering with (adjusted) to play down the earlier data. NOAA quotes the U.N.s IPCC political committee.
The 1930s was the warmest decade since the end of the Little Ice Age in the 1800s based solely on the raw data.
This seemed to raise the temperature less than .5 degree very quickly in the 1980s-90s. Ice caps on Mars were melting at this time. The temperature stabilized after 1999 and by 2012 was dropping.
Hysteresis thus slowed an immediate temperature rise, and the temperature continued to rise as heat worked its way through the system for a decade or two, even after solar output dropped.
Then it stabilized for a decade, but now it's falling as solar output has decreased and the heat from previous years radiated into space from the poles. That's why the last two springs have been so cool.
That's what's behind the sea ice melt in the Arctic that has been open three times in the last 10,000 years. Polar bears did just fine. The Little Ice Age ended in the 1900s, and the temperature should have gone back up.
Mechanisms of homeostasis: feedback.
When a change of a variable occurs, there are two main types of feedback:
Negative feedback is a reaction in which the system responds in such a way as to reverse the direction of change. Since this tends to keep things in a broad range, it allows the maintenance of homeostasis.
In positive feedback, the response amplifies the variable's change. This change has a destabilizing effect on homeostasis. Positive feedback is less common in natural systems than negative feedback.
Here's why the climate apocalypse computer models have failed. Activists assumed that above a certain level of "greenhouse gasses," feedback would feed on itself, cooking the polar bears.
This claim was nonsense as in ancient times when many times present CO2 levels did no such thing. CO2 levels don't track temperature changes in the real world driven by the sun and cosmic rays - by ocean currents - and to a lesser degree, geology.
The effect of additional CO2 is, at best, background noise. Yes, we should do away with burning coal, etc., for several reasons - but not to impose totalitarian political agendas or religion.
Nuclear and gas are apparent candidates - there are no real technical problems with nuclear and new designs can even recycle and "burn" spent fuel rods for several centuries.
Nuclear would be a big plus for the environment, but environmentalists are still opposed to nuclear power. They have other agendas.
Bristol, Virginia-Tennessee broke a record for cold on April 15, 2014. The temperature plunged to 24 degrees Fahrenheit, killing my tomato plants.
Industrial Revolution
"The Industrial Revolution was the transition from creating goods by hand to using machines. Its start and end are widely debated by scholars, but the period generally spanned from about 1760 to 1840."
Ref. https://education.nationalgeographic.org/resource/industrialization-labor-and-life Jun 2, 2022.
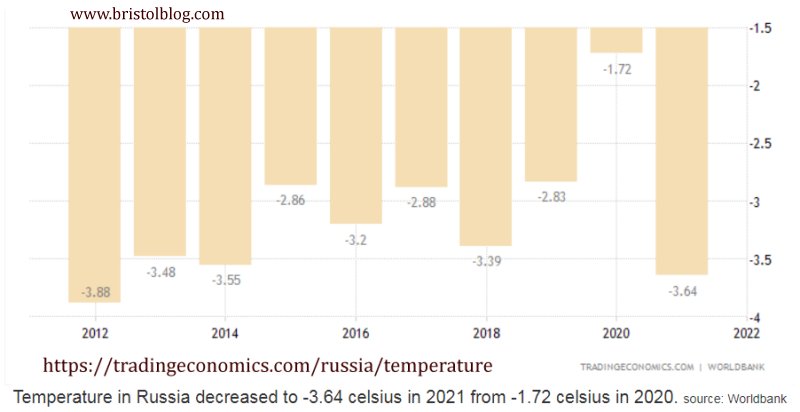
Fig. 2
New Little Ice Age in the offing?
Notice the image above: yearly temperature variations can be considerable.
A report predicts a sharp reduction in solar activity in the coming 30 years.
Some fear it could produce Little Ice Age like that between 1645 and 1715. Russian physicists urge caution in such forecasts.
Ref. http://english.ruvr.ru/2011/06/15/51814917/ 15 June 2011. (Dead link 2022)
A similar report from the National Academies Sciences predicted a new ice age in 1973.
Russia is enduring its harshest winter in over 70 years (2012), with temperatures plunging as low as -50 degrees Celsius. Dozens of people have already died, and almost 150 have been hospitalized.
The country has not witnessed such a long cold spell since 1938, meteorologists said, with temperatures 10 to 15 degrees lower than the seasonal norm all over Russia.
Across the country, 45 people have died due to the cold, and 266 have been taken to hospitals. In total, 542 people were injured due to the freezing temperatures, RIA Novosti reported...Over the weekend, meteorologists predict temperatures will plunge even lower in the Moscow region, hitting -25. The Russian capital is also expected to be swept with snow, RIA Novosti reported.
Temperatures have been 7 degrees lower than the norm for five days already, which is considered an anomaly, according to the Meteonovosti.ru website. The cold spell in the Moscow region is expected to continue for at least three more days. Ref. RIA Novosti December 19, 2012.
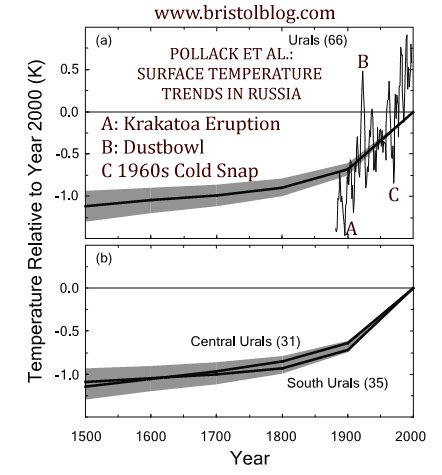
Fig. 3
Because we have severe cold and warm spells at differing times means little. In 2022 Europe is suffering through a drought the same as it did in 1920-21.
Another headline: "Dec 10, 2021 Historically frigid weather, tens of degrees below zero, has invaded northeast Russia, Scandinavia, Alaska and northern Canada in recent weeks."
Ref. Historic cold grips Siberia, Scandinavia and parts of Alaska https://www.washingtonpost.com.
This is illustrated in Fig. 3. A series of borehole measurements in Russia allowed climatologists to reconstruct temperatures across Russia for the last 500 years.
This is an example of hysteresis. Scientists from the 1600s observed low sunspot activity, thus lower solar output. About 1800 solar output increased, temperature increased in Russia by ~0.25 Deg. C from 1800-1900. It takes time to overcome changes in temperature, in the case cold oceans and ice cover slowed the process.
By 1900 to 2000 temperature increased another 0.75 Deg. C. Notice the many positive and negative spikes from 1900 to 2000. The overall average is positive.
Other factors can come into play. Many glaciers formed during the Little Ice Age were melting. This means less reflected sunlight. Soot and pollution from industry settling on ice and glaciers may have accelerated their melting. This is positive feedback.
But this kind of pollution can work both ways by reflecting sunlight.
The sun has grown brighter since the 1800s. To quote NASA:
"Since the late 1970s, the amount of solar radiation the sun emits, during times of quiet sunspot activity, has increased by nearly 0.05 percent per decade, according to a NASA funded study. This trend is important because, if sustained over many decades, it could cause significant climate change. ... Historical records of solar activity indicate that solar radiation has been increasing since the late 19th century. If a trend, comparable to the one found in this study, persisted throughout the 20th century, it would have provided a significant component of the global warming the Intergovernmental Panel on Climate Change reports to have occurred over the past 100 years."
Ref. https://www.nasa.gov/vision/universe/solarsystem/solar_trend_change_climate.htm
This precisely tracks the borehole data from Russia. This trend is NOT a linear relationship.
Let me be clear: this DOES NOT explain all of the observed warmings. Note these kinds of observations, before the 1970s, were not available.
There has been warming for over 200 years. Ice has been melting, and the oceans have been warming. As they gradually warm overall temperatures will increase. So-called greenhouse gases certainly play a part; how great we don't know.
Sunspot activity measurements in the modern sense go back to 1755. Sunspots run in 11-year cycles, but their duration and intensity vary. Some predict another cooling period with low activity, and that will be the case if true. That was a few years ago; that might not be the case in 2022.
Another positive feedback is that increased sunspot activity mitigates cosmic rays from affecting the atmosphere. Less cosmic rays mean less cloud formation and less reflected sunlight. Thus more warming.
Present cycle 25 began in 2019 and "will increase until a peak sometime between 2023 and 2025." This trend means the atmosphere will heat up and expand, putting a drag on satellites. It also means more radiation problems for the space station.
I'm guessing it will get warmer minus some negative feedback. There should be a temperature rise by pumping more energy into the system.
To further quote, "The first half of 2022 saw sunspot and solar flare activity on the sun increase significantly, including some of the most powerful flares seen in several years."
All of the experts are debating the issue. There has yet to be a consensus.
Ref. Sun's Upcoming Peak of Sunspot and Solar Flare Activity Could Set Records, Eric Mack August 5, 2022.
URL: https://www.cnet.com/science/space/suns-upcoming-peak-of-sunspot-and-solar-flare-activity-could-set-records/
Ref. JGR Soild Earth Volume 108, Issue B4, April 2003: Surface temperature trends in Russia over the past five centuries reconstructed from borehole temperatures.
California Cold Hits Record Low Temperatures
(Left here as a reference.)
In Los Angeles movie stars bundled up against the cold. California citrus growers fight to save their crops. In the Los Angeles area, famously torrid Woodland Hills, which usually makes news for its triple-digit temperatures, hit a low of 30 degrees Sunday morning. That was warm compared to Lancaster in north Los Angeles County, which hit 15 degrees...
Temperatures reached the low 20s in the San Francisco Bay Area...In San Diego, zoo keepers offered extra heat and shelter for some animals.
The cold air was flowing east into neighboring Arizona, where metropolitan Phoenix was approaching the halfway point in a four-day cold snap that's expected to mark the coolest stretch the area has seen since 1988. Temperatures late Saturday dipped to 30 degrees at Phoenix Sky Harbor International Airport.
Low temperatures across Arizona included 23 at Tucson International Airport and 7 below in Flagstaff. So says the Huffington Post 01/13/13.
Religious Articles Index
Origins Christianity


- Environmentalism 50 Years of Observation
- Government Study on Climate Change Raises Questions
- Paradise California Fire Ignore Natural Causes
- Ecology as Environmental Socialism
- Peripheral Virginia Versus Climate Change Activism
- Nature's End? Crackpots Get It Wrong Again
- Our Obsession with Armageddon, Some Welcome It
- Science Ignorance Doomed Biosphere 2
- Common Sense Environmentalism
- Spiritual Ecology Versus Science
- Green Religion Won't Save Appalachia
- How Ecological Homeostasis and Hysteresis Regulate Climate
- Ages of Gaia Writer James Lovelock Sounds an Alarm
- Writer James Lovelock Backtracks on Revenge of Gaia
- How Bacteria Created Natural Nuclear Fission
- 20th Century Not Warmest, Researchers Find
- Great Dying Mystery and the End of the Dinosaurs
- Bikini Atoll Recovery From Nuclear Blasts
- Earth Going Green Environmentalists in Denial
- Origins of the Moon and Life on Earth
- Virginia Congressman Confronts Climate Scientists
- Michael Crichton Speech - Environmentalism as Religion
- Environmentalism as Religion by Michael Fumento
- Environmentalism's Fear-Loathing of Technology
- Shockingly Rapid Climatic Shifts are Real
- Hypsithermal Warming Spreads Civilization 6000-9000 BC
- Dr. James Hansen Paid Environmentalist
- NASA Scientist Demands Prosecution Climate Change Critics
- Dissecting Al Gore's Book Earth in the Balance
- Dr. Easterbrook on Climate Change
- Science Rejected by Global Warming Alarmists
- Separation of Environmentalism and State
- 2009-10 Record Cold Stumps Environmentalists
- Taking a Sober View on Climate Change
- Second Great Awakening An Overview
- Critical Review Regressive Liberalism
- Address Corporate Culture Before Handing Out Money
- Postmodernism Attacks Reason, Science, and Culture
- Off Site:
- Web Master
- Tri-Cities VA-TN
- General Science
- Hobby Electronics
- US Constitution
- Christianity 101
- Religious Themes
Web site Copyright Lewis Loflin, All rights reserved.
If using this material on another site, please provide a link back to my site.