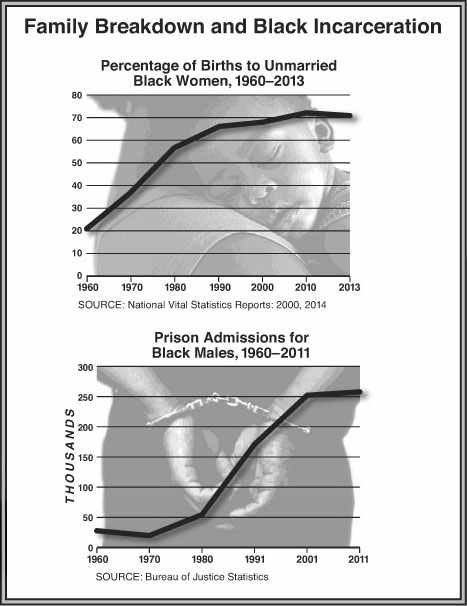
Crime Rates Proportional Single Mothers
Summary: violent crime is the end result of single mothers and social breakdown regardless of race.
Violent crime including gun crime is proportional to "diversity" meaning low-achieving non-Asian minorities. The ten most violent cities share much in common: white populations under 50 percent and controlled by Democrat administrations.
The causes of this problem directly lie with unwed mothers and lack of jobs for unskilled workers many further hobbled by drug and substance abuse and never developing a work ethic. The job problems are made worse by mass immigration that has pushed marginal workers of all races out of the labor force.
To quote "10 Most Dangerous Cities In America" by Thomas C. Frohlich, Alexander Kent & Alexander E.M. Hess:
"Despite the nation's improving crime rates, a number of large U.S. cities are still especially dangerous. Nationwide, 368 violent crimes were reported for every 100,000 people in 2013. Such crimes include murder, rape, aggravated assault, and robbery. In America's 10 most dangerous cities, there were more than 1,300 violent crimes per 100,000 residents. Based on violent crime data published by the FBI's 2013 Uniform Crime Report, these are America's most dangerous cities.
In many of these cities, high murder rates are especially problematic. Three of these cities - Detroit, St. Louis, and Baltimore - had nation-leading murder rates of 45, 38, and 37 per 100,000 people, respectively, in 2013. In all, eight of the 10 cities with the highest violent crime rates were also among the 25 cities with the highest murder rates."
Based on a Goggle search I found these listed as the ten most violent cities. Some come as no surprise and but a few are a surprise. Rockford, Ill. at 65 percent white and about 21 percent black. But a map that shows crime by district shows high crime levels in black areas and around public housing
.New Orleans wasn't included, but was included along with St. Louis and Baltimore among the 50 most violent cities in the world.
These rankings are based on violent crimes per 100,000 people so New Orleans has far more crime overall than Rockford which only had a puny 19 murders in 2013.
Poverty rates were also of interest in that except for Detroit here in Southwest Virginia the poverty rates exceeded that of the other nine - yet we have a fraction of the crime of these communities. Even West Virginia with the highest poverty rates in the nation (actually it's California when they factor in cost of living) is its low violent crime rates. The region is 90 percent plus white.
10. Birmingham, Ala.
Violent crimes per 100,000: 1,345
Population: 212,001
2013 murders: 63 (25th highest)
Poverty rate: 30.7% (18th highest)
Pct. of adults with high school degree: 84.0% (105th lowest)
According to the 2010 U.S. Census:
73.4% African American (Black)
22.3% Caucasian (White)
3.6% Hispanic or Latino (of any race)
Mayor is a Democrat.
9. Milwaukee, Wis.
Violent crimes per 100,000: 1,364
Population: 600,805
2013 murders: 104 (15th highest)
Poverty rate: 29.0% (29th highest)
Pct. of adults with high school degree: 81.8% (tied-73rd lowest)
According to the 2010 Census, 44.8% of the population was White (37.0% non-Hispanic white), 40.0% was Black or African American, 0.8% American Indian and Alaska Native, 3.5% Asian, 3.4% from two or more races. 17.3% of Milwaukee's population was of Hispanic, Latino, or Spanish origin (they may be of any race)(11.7% Mexican, 4.1% Puerto Rican). The mayor is a Democrat.
8. Rockford, Ill.
Violent crimes per 100,000: 1,375
Population: 150,209
2013 murders: 19 (82nd highest)
Poverty rate: 23.2% (74th highest)
Pct. of adults with high school degree: 83.6% (95th lowest)
Mayor Larry J. Morrissey (I)
As of the 2010 census, there were 152,871 people and 66,700 households. Rockford is in the center of its namesake metropolitan area. The racial makeup of the city was 65.1% White (58.4% Non-Hispanic white), 20.5% African American, 0.4% Native American, 2.9% Asian, 0.01% Pacific Islander, 7.5% from other races, and 3.6% from two or more races. Hispanic or Latino of any race were 15.8% of the population.
Also see http://www.neighborhoodscout.com/il/rockford/crime/
7. Baltimore, Maryland
Violent crimes per 100,000: 1,401
Population: 622,671
2013 murders: 233 (6th highest)
Poverty rate: 23.3% (73rd highest)
Pct. of adults with high school degree: 81.8% (tied-73rd lowest)
Mayor Stephanie C. Rawlings-Blake (D) According to the 2010 Census, 63.7% of the population was Black, 29.6% White, 0.4% American Indian and Alaska Native, 2.3% Asian, 1.8% from some other race and 2.1% of two or more races. 4.2% of Baltimore's population was of Hispanic, Latino, or Spanish origin (they may be of any race).
6. Little Rock, Ark.
Violent crimes per 100,000: 1,407
Population: 197,399
2013 murders: 35 (49th highest)
Poverty rate: 18.7% (131st lowest)
Pct. of adults with high school degree: 89.9% (80th highest)
Mayor political party unknown. As of the 2005-2007 American Community Survey conducted by the U.S. Census Bureau, White Americans made up 52.7% of Little Rock's population; of which 49.4% were non-Hispanic whites, down from 74.1% in 1970. Blacks or African Americans made up 42.1% of Little Rock's population; of which 42.0% were non-Hispanic blacks.
5. Cleveland, Ohio
Violent crimes per 100,000: 1,478
Population: 389,181
2013 murders: 55 (29th highest)
Poverty rate: 36.9% (3rd highest)
Pct. of adults with high school degree: 78.2% (44th lowest)
Mayor Frank G. Jackson (D)
The racial makeup of the city was 53.3% African American, 37.3% White, 0.3% Native American, 1.8% Asian, 4.4% from other races, and 2.8% from two or more races. Hispanic or Latino of any race were 10.0% of the population.
4. St. Louis, Mo.
Violent crimes per 100,000: 1,594
Population: 318,563
2013 murders: 120 (12th highest)
Poverty rate: 26.6% (44th highest)
Pct. of adults with high school degree: 83.3% (91st lowest)
Mayor Francis G. Slay (D)
The population was about 49.2% African American, 43.9% White (42.2% Non-Hispanic White), 2.9% Asian, 0.3% Native American/Alaska Native, and 2.4% reporting two or more races. Hispanic or Latino of any race were 3.5% of the population. (2010)
3. Memphis, Tenn.
Violent crimes per 100,000: 1,656
Population: 657,691
2013 murders: 124 (11th highest)
Poverty rate: 27.7% (35th highest)
Pct. of adults with high school degree: 82.5% (82nd lowest)
Mayor A C Wharton (D)
Black or African American: 62.6%
White: 31.7% (Non-Hispanic Whites: 29.5%)
Hispanic or Latino (of any race): 5.0%
2. Oakland, Calif.
Violent crimes per 100,000: 1,977
Population: 403,887
2013 murders: 90 (20th highest)
Poverty rate: 19.5% (135th highest)
Pct. of adults with high school degree: 80.9% (62nd lowest)
Mayor Libby Schaaf (D)
The racial makeup of Oakland was 134,925 (34.5%) White (non-Hispanic White 25.9%), 109,471 (28.0%) African American, 3,040 (0.8%) Native American, 65,811 (16.8%) Asian (8.7% Chinese, 2.2% Vietnamese, 1.6% Filipino, 0.7% Cambodian, 0.7% Laotian, 0.6% Korean, 0.5% Japanese, 0.5% Indian, 0.1% Mongolian), 2,222 (0.6%) Pacific Islander (0.3% Tongan), 53,378 (13.7%) from other races, and 21,877 (5.6%) from two or more races. Hispanic or Latino of any race were 99,068 persons (25.4%). 18.1% of the population were of Mexican descent, 1.9% Salvadoran, 1.3% Guatemalan, and 0.7% Puerto Rican.
1. Detroit, Mich.
Violent crimes per 100,000: 2,072
Population: 699,889
2013 murders: 316 (3rd highest)
Poverty rate: 40.7% (the highest)
Pct. of adults with high school degree: 78.6% (46th lowest)
Mayor Mike Duggan (D)
82.7% Black or African American;
10.6% White (7.8% non-Hispanic whites, 2.8% Hispanic whites);
Web site Copyright Lewis Loflin, All rights reserved.
If using this material on another site, please provide a link back to my site.

- Web Master
- Tri-Cities VA-TN
- General Science
- Hobby Electronics
- US Constitution
- Christianity 101
- Religious Themes
- Fall of the Late Roman Empire
- End of the Vikings in Greenland
- Lost Colony of Roanoke Island
- Whale Fossils Show Ice Free Arctic
- Modern Humans Originate in Asia 80,000 Years Ago
- Hurricanes Versus Climate Change
- Dinosaur Extinction New Questions
- Massive Meteor Explosion Kills Stone Age America
- Mythical Flood or Meteor Strike?
- Useful Science Information on Climate Change Industry
- Climate Change Gravy Train on the Defensive
- Religion is Killing Children
- Science Proves Climate Change
- Posted 9/16/2022
- Why Do EPA Scientists Oppose Public Disclosure?
- Why Public Disclosure is a Right
- 84% of Americans Fear the Government for Good Reason
- Who are the Smartest Countries? Nobel Prizes Tell the Story
- Green Technology Highly Polluting, Environmentally Destructive